Mini Case Examples: How We Reveal Real EBITDA and Cash Flows
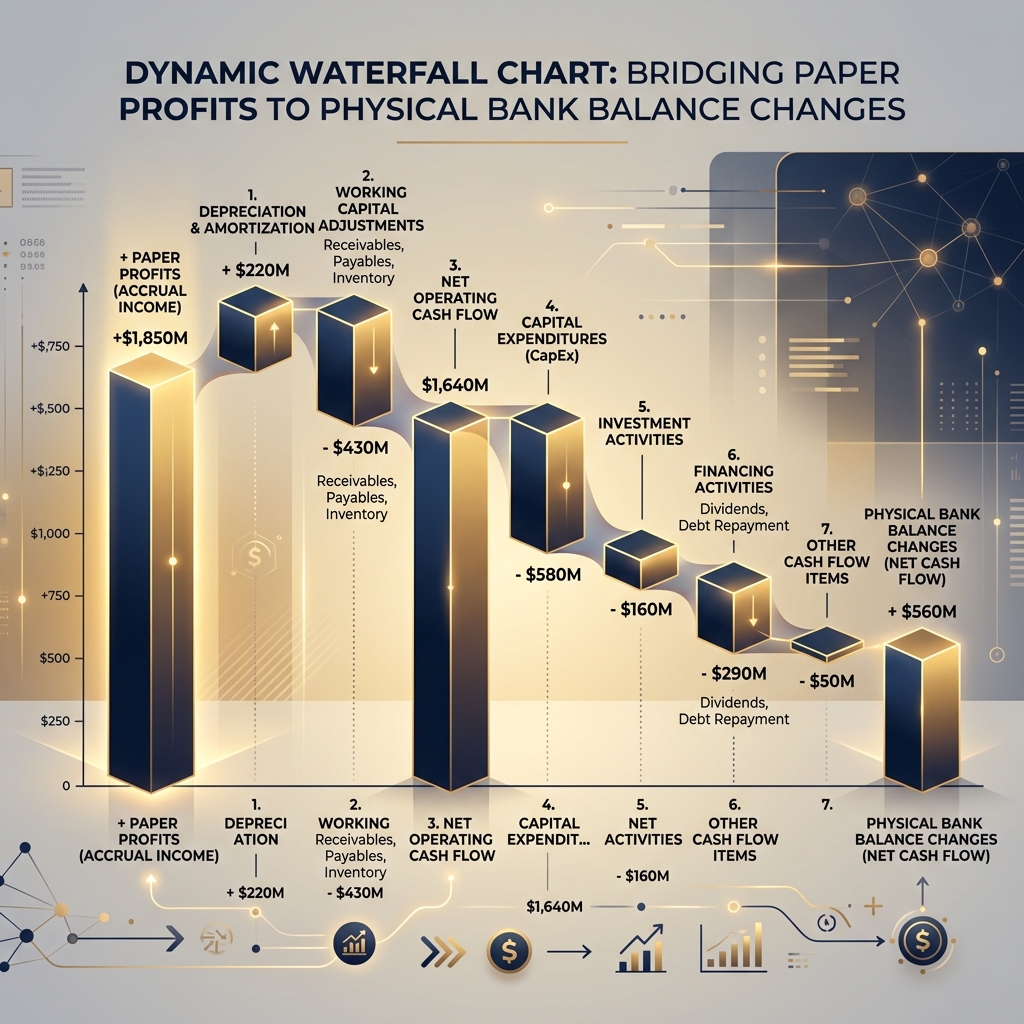
What is an EBITDA-to-Cash Waterfall chart? A Waterfall chart is a financial visualization tool that illustrates the step-by-step transition between paper EBITDA and actual changes in bank balances.
 Emplacement Image (21:9)';"
/>
Emplacement Image (21:9)';"
/>
Revealing the Reality Behind Accounting Profits
When auditing a target for acquisition or restructuring, EBITDA (Earnings Before Interest, Taxes, Depreciation, and Amortization) is the most scrutinized metric. Yet, the old financial adage remains true: “Profit is an opinion, cash is a fact.”
A high paper EBITDA does not necessarily translate into actual money in the bank. This is where the EBITDA-to-Cash Waterfall chart becomes an indispensable financial engineering tool. It visually highlights how each operational or structural line item consumes theoretical profitability.
Interactive Modeling of a Real Client Case
Here is an example of an analytical transition conducted by our teams on a target showing a €100M EBITDA:
Analyzing the Operational Cash Outflows
The chart above transparently illustrates the erosion of theoretical profits into actual cash available to the investor:
- WCR Variation (-€25M): Reflects the lag between invoicing and collections. A prolonged client payment term or overstocking immediately drains cash.
- Capex (-€15M): The tangible capital investments required to maintain production capabilities. While EBITDA excludes depreciation, the cash spent on new machinery is very real.
- Corporate Tax (-€10M): The tax liabilities disbursed during the fiscal year.
- Debt Service (-€20M): Repaying the principal and interest on active loans.
Final outcome: Out of €100M of paper EBITDA, only €30M of net cash flow is actually available to shareholders or for funding new acquisitions.
The AAM Method: Objectifying for Negotiation
In M&A negotiations, identifying these cash leakages is paramount. By objectifying each component of the waterfall, we provide the technical data required to justify price adjustments on net debt and secure contract documentation (SPA).
Explore our Financial Engineering Cases
Contact our Transaction Services division to carry out a comprehensive quality of earnings and cash flow diagnostic on your target acquisitions.
Rédigé par
The Audit-AAM Transaction Services Team